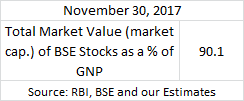
Please see my blog of July 9, 2014 for the original note on using TMV/GNP ratio to gauge whether the market is cheap or expensive, and my nonthly blogs on this subject.
Monetary Policy 2017-18 In the last two statements - October 4 and December 6 - RBI has continued with the repo rate at 6%. This is not surprising given RBI's thinking on the subject. Let's look at the two key macro variables - growth and inflation. RBI marked down the growth rate for the year, 2017-18, from 7.3% to 6.7% in the October statement, and has retained this number in last week's statement. RBI's inflation projection was raised in the second half of the year from 4-4.5% to 4.2-4.6% in October; this has been marginally raised last week to 4.3-4.7%. RBI's 2017-18 growth forecast is based on 7% in Q3 and 7.8% in Q4. Inflation has trended higher since June in line with the RBI's expectations. After the statement on Dec 6, November CPI number came in at 4.88%. This is slightly outside the range set out by the RBI.