Thursday 15 December 2016

RBI sees demonetisation as a non-event: Prescience or helplessness?

Fifth Bi-Monthly Monetary Policy Statement, December 7, 2016

Monetary Policy                                                                                                     2016-17

Not altogether a surprise that the Monetary Policy Committee chose to keep the repo rate unchanged at 6.25%.

In my blog of November 25, 2016 on the November 8 demonetisation of Rs. 500 and Rs. 1000 notes and the uncertainty it had created for the growth of the economy in FY 2016-17, I had expressed the view that a reduction in the repo rate was likely, unless the rupee comes under 
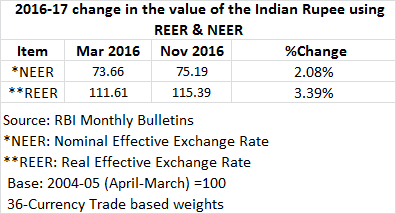
significant pressure. The rupee did come under significant pressure, falling at one point by over 3% against the U.S. dollar since the last policy announcement on October 4. In its outlook, the MPC noted that ‘U.S. monetary and fiscal policy could impact volatility to the exchange rate thereby feeding into inflation’ – the term ‘volatility’ being the RBI’s euphemism for weakness, in my view.

Significantly, the RBI sees the effects of demonetisation on the growth of the economy as purely ‘transient’. In theory this is true as demonetisation is simply the substitution of one set of notes by another happening without lag and friction.

Although, the RBI has reduced its growth target for the year from 7.6% to 7.1%, in the words of the Executive Director in the conference call with media, only 0.15% of the reduction is due to demonetisation. The remaining 0.35% is due to the lower than expected number of 7.1% for growth in Q2 FY 2016-17. Perhaps the RBI feels that it has no hard data points as yet on the effects of demonetisation on growth, despite the widespread media reports about the difficulties faced by most sectors and people in accessing cash, and the consequent slowdown in spending.

On the inflation front, there is no change in RBI’s projected inflation path – 5% by March 2017, with risks to the upside, although lower than the October policy review.
If this is the picture that the RBI has of the economy for the rest of FY16-17, then its decision to make no change in the repo rate is warranted. But is this picture correct? It is hard to believe, at least based on media reports, that this is the case so far as the growth of the economy is concerned. What about hard data points?

On December 9, the RBI released fortnightly data on credit and deposits in the banking sector. In FY 2016-17 up to November 25, credit grew by just 0.6%! At the end of two quarters, i.e. up to September 30, 2016, credit grew by 3.7%, less than the 4.2% seen in the same period during the previous year.

So from September 30 to November 25, bank credit actually fell - by Rs. 2,282 billion.  Significantly most of that fall - Rs. 1672 billion - it appears happened even before the demonetisation on November 8!


On the inflation front, where RBI did not have the benefit of hindsight, data was released just two days ago which showed that consumer price inflation for November came in at 3.63%, well below expectations. Does this suggest a softer inflation path than RBI’s current one going into March 2017? Clearly one data point is not sufficient. The RBI is in a wait and watch mode.

It is quite a surprise that at the MPC meeting all members unanimously agreed that no change in the repo rate is warranted.

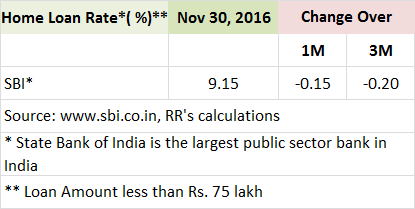
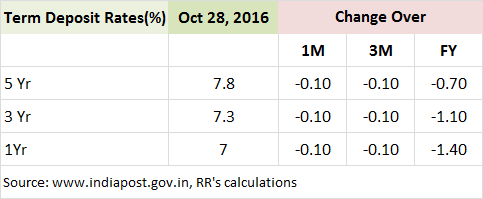
Meanwhile, some banks have cut their deposit rates and a few their lending rates.


One weakness with the MPC’s assessment and past statements is that it does not show trends in bank credit and deposits, money supply and reserve money on a regular basis - even though the RBI is directly attempting to influence both the price and flow of money in the economy through its monetary policy actions. This is necessary. 

Tuesday 13 December 2016

The value of the Rupee: update as of November 2016

Rupee at one of its highest levels since April 2004 on a real exchange rate baisis


RBI Watch                                                                                                             Rupee FX 


Please also read my April 25, 2014 blog titled "Is the Rupee fairly valued?" and my monthly blogs.


Saturday 3 December 2016

India Market Map: November 2016

A bird’s eye view of the performance of India’s financial markets. Please also see the October update.

We publish the Market Map on a monthly basis.

Current financial year

Following the shock demonetisation of Rs. 500 and Rs. 1000 notes by government, bond rates fell further by about 0.5%. This has made government bonds the best performing asset this financial year.

On a one-year basis

Government bonds are again the best performing asset.


Foreign Exchange


Stock Market


Government Bond Market


Gold Price


Money Market


Policy Rates


Bank Deposit Rates


Public Provident Fund Rate


Post Office Deposit Rates


Lending Rates


Real Estate Market


Monitoring the NaMo Bull Market in Stocks: Update as of November 2016

Indian Stock Market Watch


Please see my blog of July 9, 2014 for the original note on using TMV/GNP ratio to gauge whether the market is cheap or expensive.

Friday 25 November 2016

Demonetisation and GDP growth in fiscal year 2016-17: A presentation of three subjective scenarios

Today’s picture is not pretty: government needs to push up spending quickly and sizably to make up for a possible drop in the rest of the economy. This will ensure India's expected growth path is not disrupted in the short term.

Good buying opportunities for long term investors in the coming months in Indian stocks can be expected.

The demonetisation of Rs. 500 and Rs. 1000 rupee notes, which came into effect two weeks ago, is good for the economy and people in the long term, most Indians will agree. However, it can be argued that the implementation of this move has not been executed well.

Reports daily appear in the press and social media of the difficulties faced by people and businesses – both small and large – in conducting their daily activities both in large and small towns and across sectors.

I went yesterday to two ATM machines next to my residence, and found they dispensed only the new high value Rs. 2000 notes – which are not generally accepted at most shops for daily payments. A friend in Mumbai reported to me that she went to her bank – India’s leading private sector bank - to withdraw money, but was told that she could not withdraw money.

Rs. 500 and Rs. 1000 notes account for 85% of currency in circulation, and cash accounts for 11% of GDP in India. New notes on this massive scale need to be produced, distributed and stored in newly calibrated ATMs across India. The informal economy accounts for 40% of India’s economy, and mainly runs on cash.

Witnessing the execution of the demonetisation move, my own, clearly subjective, view is that it will take six months for cash to lubricate without friction the economy just as it did before.
I have created a picture (model) of the growth of India’s economy over FY16-17, and presented three subjective scenarios below.

Scenario 1
Informal economy shows zero growth in Q3 after demonetisation, but returns to its normal path in Q4 – The formal economy grows at 6.6% at a slower pace in Q3 after demonetisation and then returns to the normal growth path in Q4.
Net result: India’s economy grows by about 7% in 2016-17 – about 0.5% lower than expected.


Scenario 2
Informal economy shows negative growth of 5% in Q3 after demonetisation - and why not given all that I see and read in the papers - and recovers enough so that there is no fall in output in Q4 – The formal economy grows at 6.6% at a slower pace in Q3 after demonetisation, and then returns to the normal growth path in Q4.
Net result: India’s economy grows by about 6% in 2016-17 – about 1.5% lower than expected!


Scenario 3
Informal economy shows after demonetisation negative growth of 10% in Q3 and recovers enough so that there is no fall in output in Q4. The formal economy grows in Q3 at 6.6% at a slower pace after demonetisation, and then recovers, though not completely by rising to 7.2%, in Q4.
Net result: India’s economy grows by about 5.5% in 2016-17 – about 2% lower than expected!!


In this uncertain scenario, the 10% fall in India’s stock markets does not seem to be enough. Note this comes at a time when following a Trump victory in the USA interest rates are increasing – seen by many as just the beginning of a rising interest rate cycle. It looks like there will be good buying opportunities for long term investors in the coming months in Indian stocks.

My own view is that government needs to act fast and sizably to pump money into the economy – if that means a higher fiscal deficit then so be it. Government has already announced measures for the rural sector in the last week. RBI has asked banks to effectively extend the repayment period for loans by small businesses.

Inflation should trend lower. Deposit and lending rates have started coming come down. It is likely that RBI will reduce the key policy rate, the repo rate, at its next bimonthly monetary policy announcement in early December, unless the rupee comes under huge pressure.

Monday 14 November 2016

The value of the Rupee: update as of October 2016

Rupee hits second highest level on real exhange rate basis since April 2004

RBI Watch                                                                                                    Rupee FX

The moderation in the rupee in real terms last financial year has seen a significant reversal seven months into this financial year. In FY16-17, the rupee has gained more than 3% in real terms and about 2%in nominal terms.


Please also read my April 25, 2014 blog titled "Is the Rupee fairly valued?", and my blog of April 21,2016.

Tuesday 8 November 2016

Recent history and RBI's probable inflation path


Monetary Policy                                                                                                     2016-17


Please see my blog dated October 11, 2016 titled "Has RBI lowered its guard on fighting inflation?".

Tuesday 1 November 2016

Monitoring the NaMo Bull Market in Stocks: Update as of October 2016

Indian Stock Market Watch


Please see last month's updateand also my blog of July 9, 2014 for the original note on using TMV/GNP ratio to gauge whether the market is cheap or expensive.

India Market Map: October 2016


A bird’s eye view of the performance of India’s financial markets. Please also see the September update.

We publish the Market Map on a monthly basis.

Current financial Year

Stock and bonds have clearly outperformed gold.


On a one-year basis

Bonds and gold have outperformed stocks. 


Deposits

Rates have come down. Savers looking to park money for the long term look better off parking the money at the Post Office, compared to the two banks we follow.

Buying the rupee against the pound - an fx asset play- would have generated the best returns over the last one year compared to bonds, stocks and gold.


Foreign Exchange


Stock Market


Government Bond Market


Gold Price


Money Market


Policy Rates


Bank Deposit Rates


Public Provident Fund Rate


Post Office Deposit Rates


Lending Rates


Real Estate Market


Tuesday 18 October 2016